


UnoViS: The MedIT Public Unobtrusive Vital Sign Database
Motivation
While PhysioNet is a large database for standard clinical vital sign measurements [1], such a database does not exist for unobtrusively measured signals. This hinders progress in the vital area of signal processing for unobtrusive medical monitoring as not everybody owns the specific measurement systems to acquire such signals. Furthermore, if no common database exists, a comparison between different signal processing approaches is not possible. This gap will be closed by our UnoViS database. It contains different measurements in various scenarios ranging from a clinical study to measurements obtained while driving a car.
Initially, 145 records with a total of 16.2 hours of measurement data were made available, provided as MATLAB files or in the PhysioNet WFDB file format. In its initial state, only capacitive ECG and unobtrusive PPG signals were, together with a reference ECG, included. The dataset from the clinical study contains clinical annotations. Additionally, supplementary functions are provided, which simplify the usage of our database and thus the development and evaluation of new algorithms. The development of urgently needed methods for very robust parameter extraction or robust signal fusion in view of frequent severe motion artifacts in unobtrusive monitoring is now possible with our database.
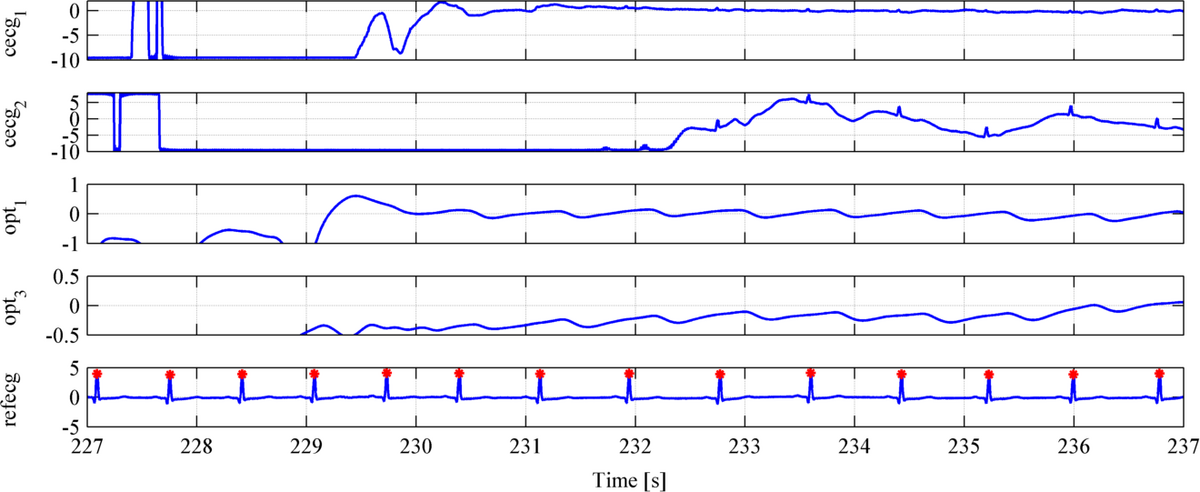
An example for the severe motion artifacts and the opportunities of a multichannel unobtrusive monitoring is shown in the following figure. While the channel cecg1 has a very low amplitude of the R-peaks even after recovering from a severe artifact, channel cecg2 shows larger amplitudes of the R-peaks. Hence, it would be beneficial to use this channel for parameter extraction. Furthermore, the optical channels opt1 and opt3 recover even faster and would thus allow to increase the time in which a reliable heart rate could be estimated. This example clearly shows the opportunities of multichannel unobtrusive monitoring. Our database shall stimulate the research of very robust signal processing algorithms like peak detection, heart rate estimation or sensor fusion, in view of severe and frequent motion artifacts, as these methods are a key aspect for the success of unobtrusive, ubiquitous medical monitoring.
Content of the dataset
Intially, 145 records with a total of 16.2 hours of measurement data were made available, collected between 2009 and 2013 [2-5] and provided as MATLAB files or in the PhysioNet WFDB file format. Additionally, supplementary functions are provided, which simplify the usage of our database and thus the development and evaluation of new algorithms. The data is available as a MATLAB mat-file or in several files per record in accordance to the PhysioNet WFDB (WaveForm DataBase) file format.
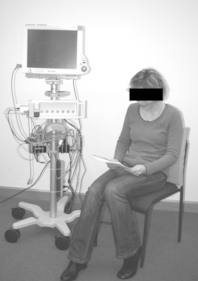
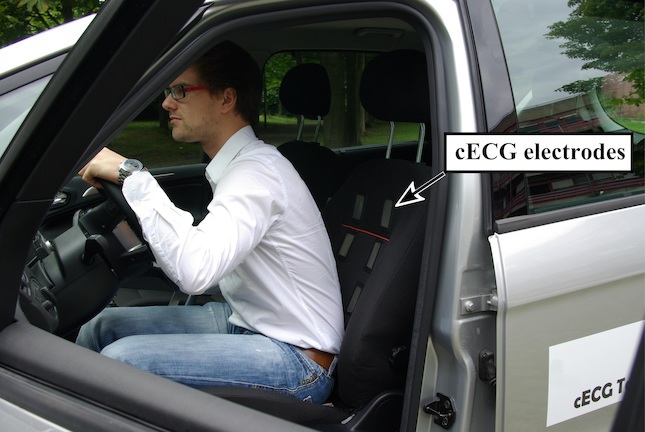
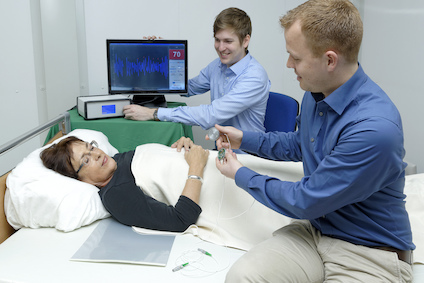
The origin of the data is manifold and currently consists of three application scenarios: measurements of a clinical study [2], measurements while the subject is driving a car [3], [4] and measurements while the subject is lying in bed [5]. Additionally, two records show the maximum measurement quality of our latest system if conditions are optimal. Since the measurements were acquired over a long time period of several years, slightly different (improved) measurement systems were used. In all scenarios, the monitored subjects wore their normal clothes.
Structure of the dataset
Terms of use
The database is completely free and can be used for any purpose. However, we kindly ask to cite this publication if the database and / or its supplementary functions are used:
T. Wartzek, M. Czaplik, C. Hoog Antink, B. Eilebrecht, R. Walocha and S. Leonhardt: "UnoViS: The MedIT Public Unobtrusive Vital Sign Database", Health Information Science and Systems. 2015;3:2. https://link.springer.com/article/10.1186/s13755-015-0010-1
Structure
The database consists of records which represent one measurement each. That means, a record contains, for example, one measurement of one patient in case of the clinical study, or one driver driving in a specified scenario in case of the driving tests and so on. It should be pointed out that several records may exist for the same subject in the driving or lying in a bed scenario. However, these records are of course labeled with the same unique subject ID but different record IDs. The structure of each record in case of the MATLAB file is given in Table I.
| Field | Datatype | Occurrence | Content | Example | |
|---|---|---|---|---|---|
| id | 1×n | char | Always | Unique identifier of each record | UnoViS_auto2012_1 |
| duration | 1×1 | single | Always | Duration of record in seconds | 500 |
| measScenario | 1×n | char | Always | Measurement scenario | automotive, city |
| Subject | 1×1 | struct | Always | ||
| id | 1×n | char | Always | Unique identifier of each subject | p1 |
| clothes | 1×n | char | Optional | Clothes worn | cotton shirt |
| age | 1×1 | uint8 | Optional | Age of subject in years | 32 |
| bmi | 1×1 | single | Optional | Body mass index (kg m−1) | 23.4 |
| sex | 1×1 | char | Optional | Sex | m |
| Channels | 1×n | struct | Always | Varying number of n 1×1 structs | |
| type | 1×n | char | " | Type of channel | cecg |
| name | 1×n | char | " | Name of channel | cecg_1 |
| fs | 1×1 | single | " | Sampling rate (Hz) | 200 |
| data | n×1 | single | " | Raw data (a.u.) | |
| ann | 1×n | struct | Optional | Varying number of n 1 x 1 structs | |
| type | n×1 | char | " | Type of annotation | peaks |
| source | n×1 | char | " | Source/origin of annotation | osea |
| loc | n×1 | uint32 | " | Location(s) of annotation(s) (samples) | [25 125 191] |
| val | Value of the annotation depends on annotation type. Details are given in Table 2. | ||||
The presented structure of one record is saved as a struct. Each record consists of several fields such as a unique id, the duration of the measurement, the measurement scenario measScenario, information about the subject and several channels containing the actual measurement data and annotations ann.
| Dataset | Type | Meaning | Source | Value | Datatype | |
|---|---|---|---|---|---|---|
| All | peaks | Detected peaks | osea | OSEA Typecode | 1×1 | int8 |
| All | peaks | Detected peaks | manual | OSEA Typecode | 1×1 | int8 |
| UnoViS_clin2009 | rhythm | Atrial fibrillation present? | manual | 1/0/NaN | 1×1 | logical |
| UnoViS_clin2009 | extrasys | Extrasystole present? | manual | 1/0/NaN | 1×1 | logical |
| UnoViS_clin2009 | bbb | Bundle branch block? | manual | 1/0/NaN | 1×1 | logical |
| UnoViS_clin2009 | hr | Heart rate | manual | [mean, relative difference] | 2×1 | single |
| UnoViS_clin2009 | pq | PQ time | manual | [mean, relative difference] | 2×1 | single |
| UnoViS_clin2009 | qrs | QRS time | manual | [mean, relative difference] | 2×1 | single |
| UnoViS_clin2009 | qt | QT time | manual | [mean, relative difference] | 2×1 | single |
The field ann is an array of structs within each channel. It contains the class (e.g. peaks or rhythm), the subclass which may be event based (e.g. in case of the class peaks) or interval based (e.g. in case of the clinical study the clinicians analyzed an interval of 5 s), the source (e.g. manual by medical experts or automatic by the open source ECG detector OSEA [6]) and the location loc of the annotation in samples. The type of the annotation(s) depends on the annotation class and subclass and is further elucidated in Table II. This table also shows all currently available annotations. All datasets contain detected peaks from OSEA or by a medical expert. In case of the measurements from the clinical study, this dataset contains the following annotations for the cECG as well as for the reference ECG. The diagnosed rhythm and if extrasystoles extrasys or a bundle branch block bbb are present. If the two clinicians could not clearly identify a parameter or if their results differed, it is denoted with NaN or ’-2’. Furthermore, the heart rate and different time durations such as PQ, QRS and QT time are given. Here, the mean value of the two clinicians’ results and the relative difference are given. Again, if one parameter, e.g. the PQ time, could not be clearly estimated, it is denoted with NaN.
Download
The data can be downloaded here:
| Dataset | Signaltypes | # of Records | Total Length | mat-file | wfdb files |
|---|---|---|---|---|---|
| UnoViS_clin2009 | 1 capacitive ECG and 1 reference ECG | 92 | 55 min | ZIP | ZIP |
| UnoViS_auto2012 | 3 capacitive ECGs 1 reference ECG | 31 | 13.4 h | ZIP | ZIP |
| UnoViS_bed2013 | 3 capacitive ECGs 3 optical pulse | 20 | 1.7 h | ZIP | ZIP |
| UnoViS_opti2013 | 3 capacitive ECGs 3 optical pulse 1 reference ECG | 2 | 6.3 min | ZIP | ZIP |
The supplementary MATLAB functions can be found here:
Extensions
1.) A Synthesizer Framework for multimodal cardiorespiratory signals
In [7], our group has published a synthesizer for the generation of multimodal cardiorespiratory signals. Below, a MATLAB demonstration can be downloaded for free. This code was used to generate Figure 14 of the original publication. As the UnoViS database, this code is completely free but we kindly ask you to cite the original publication:
C. Hoog Antink, S. Leonhardt, and M. Walter, “A Synthesizer Framework for Multimodal Cardiorespiratory Signals”, Biomed. Phys. Eng. Express 3 (2017) 035028, https://doi.org/-10.1088/2057-1976/aa76ee.
| MATLAB demonstration | Download |
|---|---|
| Synthesizer Demo | ZIP |
2.) Motion Artifact Quantification and Sensor Fusion for Unobtrusive Health Monitoring
A multisensor setup for unobtrusive vital sign estimation was published by our group in [8]. Here you can download the data of the “Motion Sequence” (UnoViS_motion2017) and the video sequence “Video Sequence” (UnoViS_video2017). The data format is the same as the UnoViS-database. We currently do not provide the data in WFDB format but we can convert it for you if necessary. As with the original database, the data is completely free but we kindly ask you to cite the original publication:
C. Hoog Antink, F. Schulz, S. Leonhardt, and M. Walter, “Motion Artifact Quantification and Sensor Fusion for Unobtrusive Health Monitoring”, Sensors 2018, 18(1), 38; https://doi.org/10.3390/s18010038.
| Dataset | Signaltypes | # of Records | Total Length | mat-file |
|---|---|---|---|---|
| UnoViS_motion2017 | See [8] | 9 | 81 min | ZIP |
| UnoViS_video2017 | See [8] | 7 | 7.1 h | ZIP |
3.) Signal-Level Fusion with Convolutional Neural Networks for Capacitively Coupled ECG in the Car
In [9], we presented an algorithm for beat-detection in multi-channel capacitively coupled ECG. This algorithm is written in Python and makes use of the “Keras” as well as the “TensorFlow” package (among others). To use this demo, you also need to download the “UnoViS_auto2012” MAT-file you find above. As the UnoViS database, this code is completely free but we kindly ask you to cite the original publication:
C. Hoog Antink, E. Breuer, D. U. Uguz, and S. Leonhardt, “Signal-Level Fusion with Convolutional Neural Networks for Capacitively Coupled ECG in the Car”, in 2018 Computing in Cardiology (CinC 2018);45, doi: https://doi.org/10.22489/CinC.2018.143.
| Python Code | Download |
|---|---|
| CNN_Fusion | ZIP |
4.) Heart Pacemaker spike can be detected in the capacitive ECG signal
In a clinical study [10], we tested our capacitive ECG car seat on patients with cardiac pacemakers. The multichannel cECG and accompanying reference ECG measurements are provided here in anonymous format for further research purposes. As the UnoViS database, the data and accompanying code is completely free but we kindly ask you to cite the original publication:
D. U. Uguz, R. Dettori, A. Napp, M. Walter, N. Marx, S. Leonhardt, C. Hoog Antink, „Car seats with capacitive ECG electrodes can detect cardiac pacemaker spikes“, Sensors 2020 (20), 6288. doi: https://doi.org/10.3390/s20216288.
| Dataset | Signaltypes | # of Records | Total Length | mat-file |
|---|---|---|---|---|
| UnoViS_pacemaker2020 | See [10] | 97 | 38 min | ZIP |
5.) A Portable Multi-Modal Cushion for Continuous Monitoring of a Driver’s Vital Signs
A multi-sensor setup for unobtrusive vital sign estimation was published by our group in [11]. The 4xU sensor data including capacitive ECG, magnetic inductance measurement, PPG and Seismocardiography accompanying the paper can be assessed here. As with the original database, the data is completely free but we kindly ask you to cite the original publication:
O. Linschmann, D.U. Uguz, B. Romanski, I. Baarlink, P. Gunaratne, S. Leonhardt, M. Walter, M. Lüken, „A Portable Multi-Modal Cushion for Continuous Monitoring of a Driver’s Vital Signs“, Sensors 23 (8), 4002, 2023. https://doi.org/10.3390/s23084002.
| Dataset | Signaltypes | # of Records | Total Length | mat-file |
|---|---|---|---|---|
| CuMuMoVi | See [11] | 20 | 8.1 h | ZIP |
If you have any questions, please contact us at: unovis-support@hia.rwth-aachen.de
References
- A. L. Goldberger, Amaral, L. A. N., L. Glass, J. M. Hausdorff, P. C. Ivanov, R. G. Mark, J. E. Mietus, G. B. Moody, C.-K. Peng, and H. E. Stanley, “PhysioBank, PhysioToolkit, and PhysioNet: Components of a New Research Resource for Complex Physiologic Signals,” Circulation 101(23):e215–e220, 2000, doi:https://doi.org/10.1161/01.CIR.101.23.e215
- M. Czaplik, B. Eilebrecht, R. Walocha, M. Walter, P. Schauerte, S. Leonhardt, and R. Rossaint, “The reliability and accuracy of a noncontact electrocardiograph system for screening purposes,” Anesthesia and Analgesia, 114(2):322–327, 2012, doi: https://doi.org/10.1213/ane.0b013e31823f4182
- B. Eilebrecht, T.Wartzek, J. Lem, R. Vogt, and S. Leonhardt, “Capacitive electrocardiogram measurement system in the driver seat,” Automobiltechnische Zeitschrift (ATZ), 113(3):232–237, 2011, doi: https://doi.org/10.1365/s38311-011-0034-3
- T. Wartzek, B. Eilebrecht, J. Lem, H.-J. Lindner, S. Leonhardt, and M. Walter, “ECG on the Road: Robust and Unobtrusive Estimation of Heart Rate,” IEEE Transactions on Biomedical Engineering, 58(11):3112–3120, 2011, doi: https://doi.org/10.1109/TBME.2011.2163715
- T. Wartzek, C. Brüser, T. Schlebusch, C. Brendle, S. Santos, A. Kerekes, K. Gerlach-Hahn, S. Weyer, K. Lunze, C. Hoog-Antink, and S. Leonhardt, “Modeling of Motion Artifacts in Contactless Heart Rate Measurements,” in 2013 Computing in Cardiology (CinC 2013), 22 - 25 Sep 2013.
- P. S. Hamilton, "Open Source ECG Analysis Software Documentation," Computers in Cardiology, Memphis, TN, USA, 2002, pp. 101-104, 2002, doi: https://doi.org/10.1109/CIC.2002.1166717
- C. Hoog Antink, S. Leonhardt, and M. Walter, “A Synthesizer Framework for Multimodal Cardiorespiratory Signals”, Biomed. Phys. Eng. Express 3 (2017) 035028, doi: https://doi.org/10.1088/2057-1976/aa76ee.
- C. Hoog Antink, F. Schulz, S. Leonhardt, and M. Walter, “Motion Artifact Quantification and Sensor Fusion for Unobtrusive Health Monitoring”, Sensors 2018, 18(1), 38, doi: https://doi.org/10.3390/s18010038
- C. Hoog Antink, E. Breuer, D. U. Uguz, and S. Leonhardt, "Signal-Level Fusion with Convolutional Neural Networks for Capacitively Coupled ECG in the Car”, in 2018 Computing in Cardiology (CinC 2018);45, doi: https://doi.org/10.22489/CinC.2018.143
- D. U. Uguz, R. Dettori, A. Napp, M. Walter, N. Marx, S. Leonhardt, C. Hoog Antink, "Car seats with capacitive ECG electrodes can detect cardiac pacemaker spikes“, Sensors 2020 (20), 6288, doi: https://doi.org/10.3390/s20216288
- O. Linschmann, D.U. Uguz, B. Romanski, I. Baarlink, P. Gunaratne, S. Leonhardt, M. Walter, M. Lüken, „A Portable Multi-Modal Cushion for Continuous Monitoring of a Driver’s Vital Signs“, Sensors 23 (8), 4002, 2023, doi: https://doi.org/10.3390/s23084002.